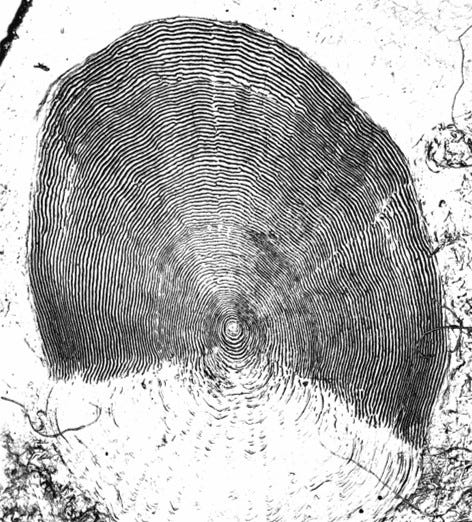
Fish scales and ear bones: A roadmap to the fish life journey

You’ve probably heard that you can count a tree’s rings to find its age, but did you know fish scales and ear bones, called otoliths, can tell a similar story about a fish?
It’s something the six staff members in WDFW’s fish ageing lab know well, as they process 60 to 80,000 Pacific salmon scales and 10 to 20,000 marine fish otoliths every year to maintain data on fish age, life history, and survival and help inform future runs and fisheries. This lab serves as the centralized hub across the department and the state for processing salmon, rockfish, ling cod, and other fish scales, fin rays, and otoliths, which help fish balance and hear things.
The data we curate at this lab is critical to fishery managers’ work with tribal co-managers to plan future salmon fishing seasons, a process referred to as North of Falcon, and informs federal stock assessments of marine fish and other state and federal research.
“For everyone in the lab, we all feel like the information you get from doing these kind of analyses serves as the backbone of a lot of these fishery decisions,” said Andrew Claiborne, ageing lab team lead. “It gives us a lot of motivation to produce high-quality data in a timely manner for the state, all the co-managers and federal partners as well.”
Age and growth

One of the biggest things scales and otoliths can tell us in our aptly named ageing lab is age. Generally, fish grow in proportion to scales and otoliths. Because fish tend to grow more in the summer than they do in the winter distinct patterns, called annuli, form. Just like you would a tree, we can interpret fish age by counting these rings in otoliths and scales.
One way fishery managers can use this age data is in something called sibling modeling, which is used to forecast future runs.
“In short, sibling models use the survival of younger fish that have returned from a cohort to estimate the survival of future returns from the cohort — that’s where things like age data really are critical,” Claiborne said.
In addition to age, we use similar metrics to understand fish movement, growth and success.
General life history and movement

WDFW researchers can also use otoliths like a road map to understand where a fish has been, including when it went out to sea — and how big it was when it made the journey. While fish scales tell a story year to year, fish otoliths form a new ring each day — and they begin forming within the first days of development. Otoliths often reflect elements from the water the fish is swimming through, as well as information about water temperature. Scientists use the elements in the otolith — like a chemical snapshot — to better understand its life history and migration patterns, including how it managed in the open ocean.
“There’s a lot we can extract from each otolith,” said Wade Smith, otolith lab team lead. “By looking at the otolith we can begin to understand the processes that impact fish survival and tell a bigger story because of that.”
Washington has pioneered a mass-marking technique, otolith thermal marking, that uses changes in water temperature to imprint a specific pattern, similar to a barcode, on each individual otolith. Hatchery managers modify the temperature at various lifecycle stages, typically pre- and post-hatching, to leave behind a subtle mark on the otolith. Started in the 90s here in Washington state, this technique is now used in Idaho, Oregon, California as well as Alaska, Japan and Russia. Through this process, fishery managers can use each otolith’s ‘barcode’ to track which hatchery the fish came from, its age, as well as to assess hatchery strategies and verify genetic data.
These are just some of the things our ageing and otolith lab studies every year as part of our work to manage fisheries while meeting conservation objectives. On top of these metrics, the lab staff also help to produce research studies, such as one that recently looked at survival of adult Chinook salmon returning to Puget Sound and Coastal Washington. Lab staff also provide research and training support to other state, tribal and federal fishery managers.
To learn more about how the state manages fish populations, visit our website.
